Electric Vehicles (EV) vs Combustion Engine (CE): A Lifecycle Emissions Analysis
Table of Contents
The Claim
A forwarded email — attributed to a Dr. Phillip A. Fields of the University of South Alabama — makes the rounds periodically, arguing that electric vehicles aren’t truly green. It cites the raw materials needed for a lithium-ion battery (25 lbs of lithium, 60 lbs of nickel, 200 lbs of copper…) and the fuel burned by mining equipment, concluding that EVs are an environmental lie.
Click to read the full text of the original email
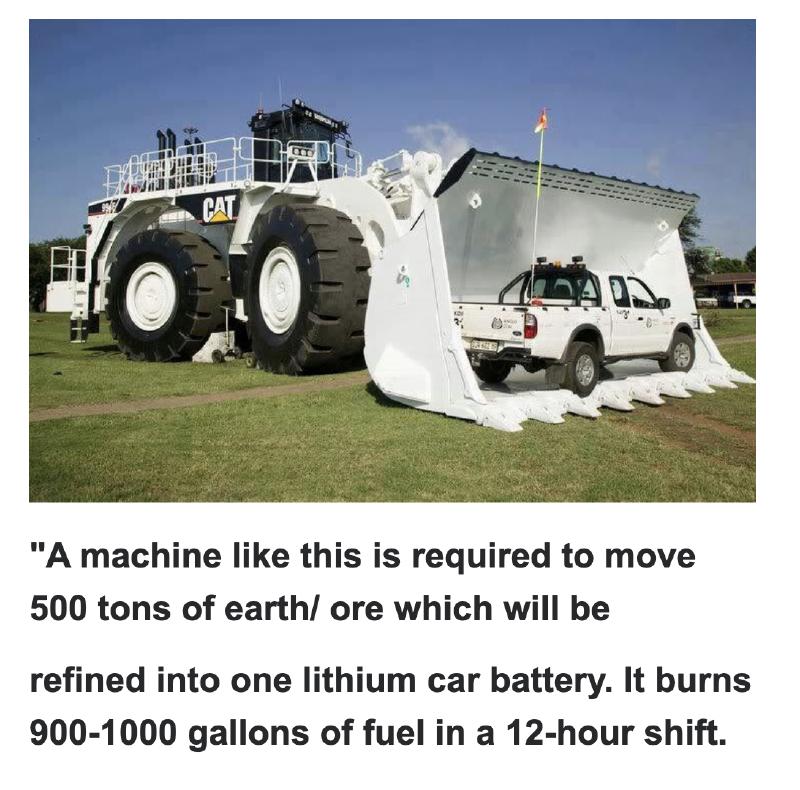
“A machine like this is required to move 500 tons of earth/ore which will be refined into one lithium car battery. It burns 900-1000 gallons of fuel in a 12-hour shift.
Lithium is refined from ore using sulfuric acid. The proposed lithium mine at Thacker Pass, Nevada is estimated to require up to 75 semi-loads of sulfuric acid a day.
A battery in an electric car, let’s say an average Tesla, is made of: 25 pounds of lithium, 60 pounds of nickel, 44 pounds of manganese, 30 pounds of cobalt, 200 pounds of copper, and 400 pounds of aluminum, steel, and plastic, etc…. averaging 750-1,000 pounds of minerals, that had to be mined and processed into a battery that merely stores electricity….
That is the truth, about the lie, of ‘green’ energy.”
— Dr. Phillip A. Fields, University of South Alabama
The numbers it presents are not necessarily wrong. But the analysis has two fundamental shortcomings.
Two Shortcomings
First, it presents absolute numbers without comparison. Saying a battery requires “1,000 pounds of minerals” or that a mining truck “burns 900–1,000 gallons of fuel in a 12-hour shift” appeals to emotion without giving context. It’s equivalent to saying “X many people die of Y” without comparing to other causes of death. What matters is the relative impact of one alternative over another.
Second, it ignores the full lifecycle. If we want to actually compare the two types of engines, we have to evaluate the entire lifecycle into scope. The main appeal of the email is to not ignore emissions produced by manufacturing the battery. Fair point, but let’s also then compare emmissions while driving (which is the of course the whole point of EVs). Also, since the email references the cost of acquiring the resources used in the battery, it’s only fair to also compare it to the cost of acquiring and producing gasoline, known as “well-to-tank” (drilling, fracking, flaring, shipping, refining).
Two valid questions remain:
- How do the emissions from driving a combustion engine (CE) car compare to the emissions from generating the electricity that powers an EV?
- How many miles do you have to drive before an EV offsets the additional emissions from manufacturing its battery?
Vehicle Lifecycle
To answer these questions, we need to compare the full lifecycle of both vehicles and fuels:
| Lifecycle Stage | Combustion Engine | Electric Vehicle |
|---|---|---|
| Vehicle Manufacturing | Standard vehicle manufacturing | Standard vehicle manufacturing + battery manufacturing (mining, refining, assembly) |
| Energy capture & delivery | Oil extraction, refining, and transport (“well-to-tank”) | Electricity generation (gas, coal, renewables, nuclear) and grid delivery |
| Driving | Tailpipe emissions from burning gasoline | Zero direct emissions (electricity emission accounted above) |
| Recycling | Standard vehicle recycling | Standard vehicle recycling + battery recycling |
By combining these, we can calculate the total emissions per mile for each vehicle type, and determine how many miles an EV must drive before its cleaner operation offsets the higher manufacturing cost. All figures below include sources, units, and formulas.
The Numbers
Vehicle Manufacturing - EV
The Swedish Energy Agency studied the emission footprint of lithium-ion battery production — mining raw materials, refining to battery-grade material, manufacturing, and recycling. They estimate:
Emissions: 145–195 kg CO2 per kWh of battery capacity
Tesla does not publish official numbers, but the publication Inside EVs estimates the battery capacity of a Tesla Model Y (2023) at:
Battery capacity: 67–81 kWh per car
Using the higher estimates for both:
Emissions: ~15,795 kg CO2 per car (≈16 tons)
195 kg/kWh × 81 kWh = 15,795 kg CO2Using higher estimates for both emission factor and battery capacity
That’s significant. But it’s a one-time cost.
Vehicle Manufacturing - CE
Standard vehicle manufacturing emissions are comparable between EVs and combustion engine cars when excluding the battery. For this analysis, we focus on the additional production cost of the EV battery, which is the email’s main concern.
Energy Capture & Delivery - EV
The U.S. Energy Information Administration (EIA) estimates CO2 emissions per kWh by fuel source (source):
| Fuel | CO2 per kWh |
|---|---|
| Natural gas | 440 g (0.97 lbs) |
| Coal | 1,025 g (2.26 lbs) |
| Petroleum | 1,107 g (2.44 lbs) |
The electricity generation mix determines how clean the grid is. Here’s how the US average compares to Washington State (source: EIA, source: Statista (WA)):
| Source | US Average | Washington |
|---|---|---|
| Natural gas | 40% | 14% |
| Coal | 20% | 3% |
| Nuclear | 18% | 8% |
| Wind | 10% | 9% |
| Hydro | 6% | 65% |
| Solar | 4% | — |
| Biomass & other | 2% | 2% |
| Petroleum | 1% | — |
Washington State benefits from predominantly hydroelectric power (65%), which means its grid is far cleaner than the national average.
US grid weighted average: ~392 g CO2 per kWh
| Source | Share | CO2/kWh | Contribution |
|---|---|---|---|
| Natural gas | 40% | 440 g | 176 g |
| Coal | 20% | 1,025 g | 205 g |
| Petroleum | 1% | 1,107 g | 11 g |
| Nuclear + renewables | 40% | 0 g | 0 g |
| Total | ~392 g |
(0.40 × 440) + (0.20 × 1,025) + (0.01 × 1,107) ≈ 392 gNote: The EIA's published US average of ~220 g/kWh (source) reflects actual grid emission intensity including plant efficiency, load factors, and emission controls. We use the higher weighted-average number throughout this analysis, which is worse for EV.
Washington grid weighted average: ~92 g CO2 per kWh
| Source | Share | CO2/kWh | Contribution |
|---|---|---|---|
| Natural gas | 14% | 440 g | 62 g |
| Coal | 3% | 1,025 g | 31 g |
| Nuclear + renewables | 84% | 0 g | 0 g |
| Total | ~92 g |
(0.14 × 440) + (0.03 × 1,025) ≈ 92 gForbes estimates the average EV efficiency in the US at 2.9 miles per kWh (source), though a Tesla Model 3 achieves about 4 miles/kWh.
| US Average | Washington | |
|---|---|---|
| EV emissions per mile | 392 ÷ 2.9 = 135 g CO2 | 92 ÷ 2.9 = 32 g CO2 |
Energy Capture & Delivery - CE
The International Energy Agency estimates “well-to-tank” emissions — extraction, flaring, methane leakage, crude transport, refining, and product transport — at 50–250 kg CO2 per barrel of oil equivalent (source).
At ~20 gallons per barrel (source), the midpoint gives us:
Well-to-tank emissions: ~2.5 kg CO2 per gallon of gasoline
(50 + 250) / 2 = 150 kg/barrel ÷ 20 gallons/barrel ≈ 2.5 kg/gallonSource: IEA (2020), Spectrum of the well-to-tank emissions intensity of global oil production
This is the number the email completely ignores: before a single mile is driven, every gallon of gasoline has already produced roughly 2.5 kg of CO2 just to extract, transport, and refine the oil it came from.
Cross-checked: The UK Department for Energy Security estimates 613 g CO2/liter “well-to-tank”, or 2.3 kg CO2 per gallon (source). These figures align.
The DOE estimates average fuel economy for model year 2020 light-duty vehicles at 25.7 miles per gallon (source).
So, the “well-to-tank” emissions per mile driven is:
Emissions for capture and delivery: 91 g CO2 per mile
2,300 g/gallon ÷ 25.7 miles/gallon ≈ 91 g/mileSource: UK Department for Energy Security (2.3 kg CO2/gallon)
Source: DOE (25.7 mpg)
Driving - EV
Zero direct emissions. The electricity consumed is already accounted for under Energy Capture & Delivery above.
Driving - CE
The EPA estimates 8.8 kg CO2 per gallon of gasoline at the tailpipe (source), and using the same average fuel consumption as above of 25.7 miles per gallon (source), we get:
Tailpipe emissions: 342 g CO2 per mile
8,800 g/gallon ÷ 25.7 miles/gallon = 342 g/mileSource: EPA (8.8 kg CO2/gallon)
Source: DOE (25.7 mpg)
The Comparison
Now we can add up emissions from energy capture and delivery and from driving, to get the total emissions per mile driven.
| Combustion Engine | Electric Vehicle | ||
|---|---|---|---|
| US Average | Washington | ||
| Energy capture & delivery in g CO2/mile | 91 | 135 | 32 |
| Driving in g CO2/mile | 342 | 0 | |
| Total emissions in g CO2/mile | 91 + 342 = 433 | 135 + 0 = 135 | 32 + 0 = 32 |
Comparing emmissions of CEs to EVs, we find:
| Electric Vehicle (US Average) | Electric Vehicle (Washington) | |
|---|---|---|
| Ratio of CEs to EVs | 433 ÷ 135 = 3.2× more | 433 ÷ 32 = 13.5× more |
So, driving an EV produces far less emissions per mile.
The next question is: how long do you have to own and drive an EV before you start saving emissions — that is, before the cleaner per-mile operation offsets the additional CO2 from manufacturing the battery?
| Electric Vehicle (US Average) | Electric Vehicle (Washington) | |
|---|---|---|
| Net savings per mile | 433 − 135 = 298 g CO2 | 433 − 32 = 401 g CO2 |
| Miles to offset battery manufacturing | 15,795,000 ÷ 298 = 53,090 miles | 15,795,000 ÷ 401 = 39,428 miles |
Americans drive about 14,263 miles per year (source).
| Electric Vehicle (US Average) | Electric Vehicle (Washington) | |
|---|---|---|
| Years to break even (at 14,263 mi/yr) | 53,090 ÷ 14,263 = 3.7 years | 39,428 ÷ 14,263 = 2.8 years |
Cumulative Emissions Over Time
The chart below shows how cumulative CO2 emissions accumulate over 10 years of driving. The EV lines start higher due to battery manufacturing, but their lower per-mile emissions mean they cross below the combustion engine line within about 3–4 years.
Since Americans keep their cars for an average of 8.4 years (source), Electric Vehicles are clearly far superior to Combustion Engine cars as far as emissions are concerned.
Additional Context
The grid is getting cleaner. The cost per kWh from solar has dropped dramatically. The Nuclear Energy Agency estimates solar at $56/MWh, compared to $71 for natural gas. Onshore wind is already at $50/MWh (source). As renewables grow, the emissions per EV mile will continue to fall.
Centralization is more efficient. From an engineering standpoint, centralizing combustion in power plants is more efficient than distributing it across millions of tailpipes. Emissions capture is easier, and modernizing fewer plants is more practical than replacing an entire vehicle fleet.
Fugitive emissions are real. Our World in Data estimates 3.9% of global emissions come from “fugitive emissions” — accidental methane leakage during oil and gas extraction and transportation. That’s double the emissions from aviation (1.9%) (source).
EV charging infrastructure is growing. As of 2025, the US has over 77,000 public EV charging ports across all 50 states (compared to 152,000 gas stations), with the network expanding rapidly (source).
Conclusion
Even using the most pessimistic estimates — the dirtiest battery manufacturing, average US grid, average vehicle efficiency — an EV offsets its manufacturing emissions in about 3 years of normal driving. Over the average ownership period of 8.4 years, the remaining 5+ years represent net emissions savings.
As MIT’s Yang Shao-Horn — Professor of Mechanical Engineering and the first woman awarded the Faraday Medal since its 1977 inception — confirms:
It depends exactly where and how the battery is made — but when it comes to clean technologies like electric cars and solar power, even the dirtiest batteries emit less CO2 than using no battery at all.
As for Dr. Phillip A. Fields, the author of the viral email: he holds a PhD in Biochemistry from Texas A&M (1975) and is a Professor in the Department of Cell Biology and Neuroscience at the University of South Alabama, College of Medicine. His area of research is reproductive biology. (Note: it is difficult to find verifiable references linking this person to the email that circulates under his name — see this analysis and this PDF.)
Dispute anything on this post? Feel free to send me a note: